Triad Real Estate Market Update · June 2026
Foreclosures Nearly Double Across the Triad — While the Nation Rises at Half the Rate
April data reveals a sharp local uptick that buyers, sellers, and homeowners in Lewisville, Clemmons, and beyond should understand.
Numbers don't always tell the whole story — but sometimes they're hard to ignore. New data from property analytics firm ATTOM puts a spotlight on the Triad in a way that warrants a closer look. Foreclosure activity across our region jumped 87% in April compared to the same month last year, nearly five times the national rate of increase. Whether you're a buyer eyeing an opportunity or a homeowner weighing your options, here's a grounded look at what the data actually shows.
What's Happening in the Triad's 12 Counties
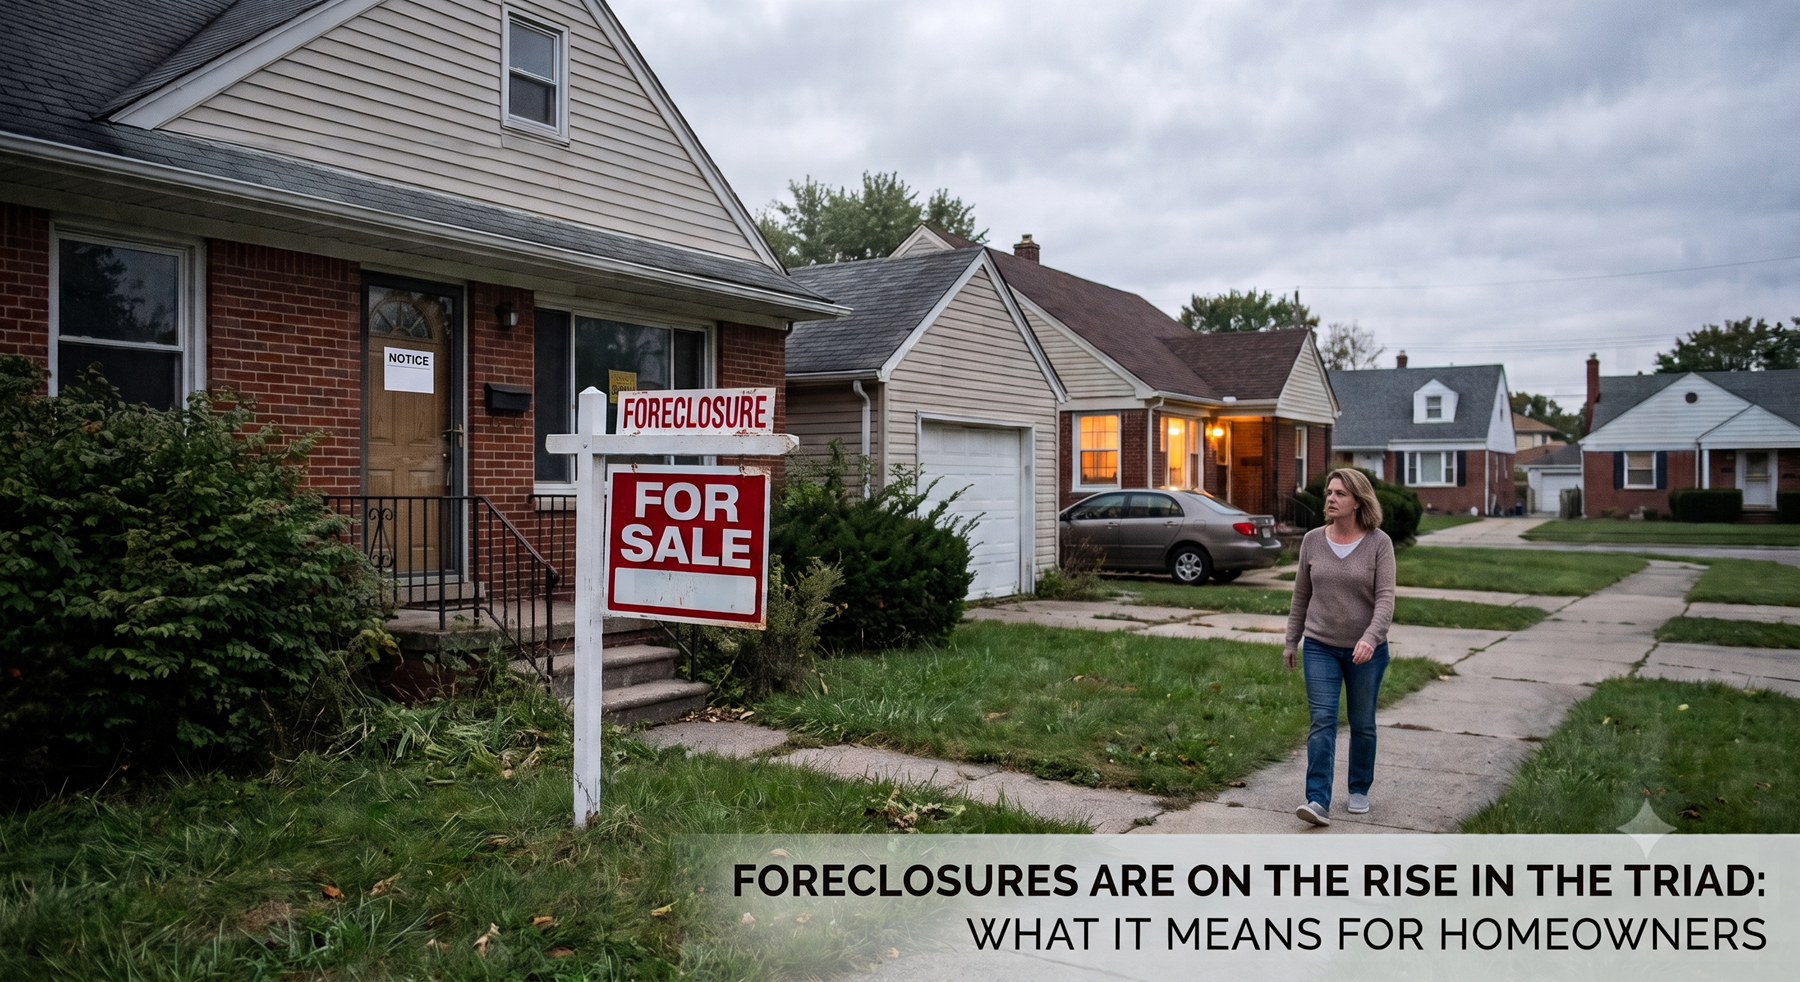
Across the Triad's 12 counties combined, filings went from 162 in April 2025 to 303 in April 2026. That's not a rounding error — it's a material shift that stands out even in the context of a nationally rising trend.
The increases weren't spread evenly. Some counties barely moved. Others saw jaw-dropping year-over-year swings. Davie County, for instance, went from a single filing in April 2025 to 22 this past April. Rockingham County was up 400%. Alamance climbed 222%. Meanwhile, Davidson County actually bucked the trend entirely and posted a decline.
Year-Over-Year Change by County (April 2025 → April 2026)
* Davie County bar scaled for readability (1 → 22 filings). Source: ATTOM, April 2026 Foreclosure Market Report.
Triad County Foreclosure Data at a Glance
| County | Apr 2025 Filings | Apr 2026 Filings | YoY Change | Notable |
|---|---|---|---|---|
| Davie | 1 | 22 | +2,100% | Largest spike in the Triad |
| Rockingham | ~Low | Higher | +400% | 2nd largest increase |
| Alamance | — | — | +222% | 3rd largest increase |
| Guilford | — | — | +100% | Largest county; doubled YoY |
| Forsyth | — | — | +35% | Below-average increase for the region |
| Davidson | — | — | ▼ Decrease | One of few counties to improve |
| Triad Total (12 counties) | 162 | 303 | +87% | Nearly 5× the national rate of increase |
A note on Davie County: Going from 1 filing to 22 sounds alarming, but context matters. A single filing in April 2025 means the baseline was essentially zero, so a small absolute change produces an enormous percentage swing. We serve Davie County regularly — and while the trend is worth watching, it's not a signal of widespread distress on its own.
How This Compares Nationally
Nationally, ATTOM counted 42,430 properties with filings in April — which works out to roughly one in every 3,388 U.S. housing units, an 18% increase over April 2025. That's meaningful, but it's being driven by well-known distress markets in the Southeast and Midwest.
States With the Highest Foreclosure Rates (April 2026)
| Rank | State | Rate (1 in X housing units) |
|---|---|---|
| 1 | Delaware | 1 in 1,739 |
| 2 | South Carolina | 1 in 1,745 |
| 3 | Florida | 1 in 2,092 |
| 4 | Indiana | 1 in 2,129 |
| 5 | Illinois | 1 in 2,262 |
| — | National Average | 1 in 3,388 |
Metro Areas With the Highest Foreclosure Rates (April 2026)
| Metro Area | Rate (1 in X housing units) |
|---|---|
| Lakeland, FL | 1 in 1,221 |
| Columbia, SC | 1 in 1,287 |
| Charleston, SC | 1 in 1,483 |
| Bakersfield, CA | 1 in 1,566 |
| Cape Coral, FL | 1 in 1,628 |
| National Average | 1 in 3,388 |
North Carolina isn't on those lists — and that's meaningful. Our state's overall foreclosure environment remains less severe than the highest-risk markets. The Triad's 87% jump is significant on a percentage basis, but in raw numbers, 303 filings across 12 counties is a far cry from the concentrated distress seen in coastal Florida or parts of the Midwest.
What the Experts Are Saying
"Foreclosure activity continued its gradual trend higher in April, with both foreclosure starts and completed foreclosures posting annual gains. While overall findings declined from the previous month, the year-over-year increases suggest lenders may be working through distressed inventory as higher borrowing costs and affordability challenges impact some homeowners." — Rob Barber, CEO, ATTOM
Barber's broader take is that this rise reflects a normalization back toward pre-pandemic activity levels rather than the beginning of a 2008-style collapse. Years of tight underwriting standards, strong home equity positions, and steady housing demand are acting as shock absorbers — at least for now.
The picture is more nuanced at the household level, though. Home prices nationally have appreciated roughly 53% since 2019, which means homeowners who bought before the pandemic are sitting on significant equity. That equity is a cushion that didn't exist for many borrowers heading into the 2008 downturn. But it doesn't help renters — and it doesn't help homeowners who bought at peak prices with thin down payments and adjustable-rate structures.
The Bigger Economic Picture: A Tale of Two Households
What makes the current moment genuinely interesting — and genuinely unequal — is the divergence between households depending on their financial position. Economists have started calling this a "K-shaped economy," where the top of the K continues rising while the bottom trends down.
Households with stock market exposure and locked-in low mortgage rates from 2020–2021 are in relatively good shape, even with inflation. They can absorb higher grocery and insurance costs by trimming discretionary spending. Their monthly housing payment hasn't changed. Their net worth has, in many cases, grown substantially.
But renters, recent buyers, and lower-income households face a different math. National apartment occupancy was sitting at 95.2% in April, according to apartment analytics firm RealPage — meaning vacancy is thin and competition is real. Rents have been climbing since January. Wage growth has been sluggish. Credit card and auto loan delinquency rates are creeping up.
"We're seeing a pickup in delinquency rates among lower-income Americans, particularly in auto loans. This could create real risks for ongoing economic growth." — Beth Ann Bovino, Chief Economist, U.S. Bank
Bovino also points to research showing the American middle class has contracted substantially over the past five decades, with income inequality now at a 60-year high. That structural backdrop matters when interpreting foreclosure data — some of what we're seeing is cyclical (lenders clearing pandemic-era backlogs), but some of it reflects real household strain that hasn't gone away.
What This Means If You're Buying, Selling, or Just Watching
If you're a buyer
Rising foreclosures can mean more distressed inventory entering the market over the next several months. Bank-owned properties and pre-foreclosure listings sometimes offer a price advantage — but they typically come with conditions (as-is sales, title complications, longer timelines). If you're interested in pursuing these types of opportunities in Forsyth, Guilford, Davie, or surrounding counties, it helps to work with someone who knows how to navigate that process from contract to close.
If you're a seller
More foreclosure activity in your county doesn't automatically drag down your home's value — especially if your property is in good condition and priced correctly for current market conditions. But it does increase the pool of competing listings, which is a reason to be thoughtful about your timing and presentation. If you've been on the fence, knowing what's moving in your specific neighborhood matters more than regional averages.
If you own your home and are feeling the squeeze
You're not alone, and options exist before things reach the foreclosure stage. If higher costs are creating strain on your budget, it's worth having a conversation with your lender about hardship programs or refinancing options — and it's worth understanding what your current equity position actually looks like. You may have more flexibility than you think.
Have Questions About What This Means for Your Home?
We work across the Triad every day — Forsyth, Davie, Guilford, Davidson, and beyond. Whether you're buying, selling, or just trying to make sense of what the market is doing, we're happy to talk through it with you. No pressure, no pitch — just a real conversation.
Get in Touch with Green Haven RealtySources: ATTOM Data Solutions, April 2026 U.S. Foreclosure Market Report (attomdata.com); RealPage Analytics, April 2026 Data Update (realpage.com); U.S. Bank Economic Insights, Beth Ann Bovino (usbank.com); Federal Reserve Bank of St. Louis, Median Sales Price of Houses Sold (fred.stlouisfed.org); Pew Research Center, The American Middle Class Is Losing Ground (pewresearch.org). This post is for informational purposes only and does not constitute financial or legal advice. Market conditions vary by neighborhood and property type. Reach out to a licensed real estate professional for guidance specific to your situation. Green Haven Realty is a licensed real estate brokerage in North Carolina.
